Spectrogram
スペクトログラム / 1940s– / Technique / Diagrammatic Expression
A visualization that maps sound onto a plane of time, frequency and intensity. From birdsong research to the DAW screen it became the standard way to see the shape of a sound, and artists have since taken to hiding pictures inside it.
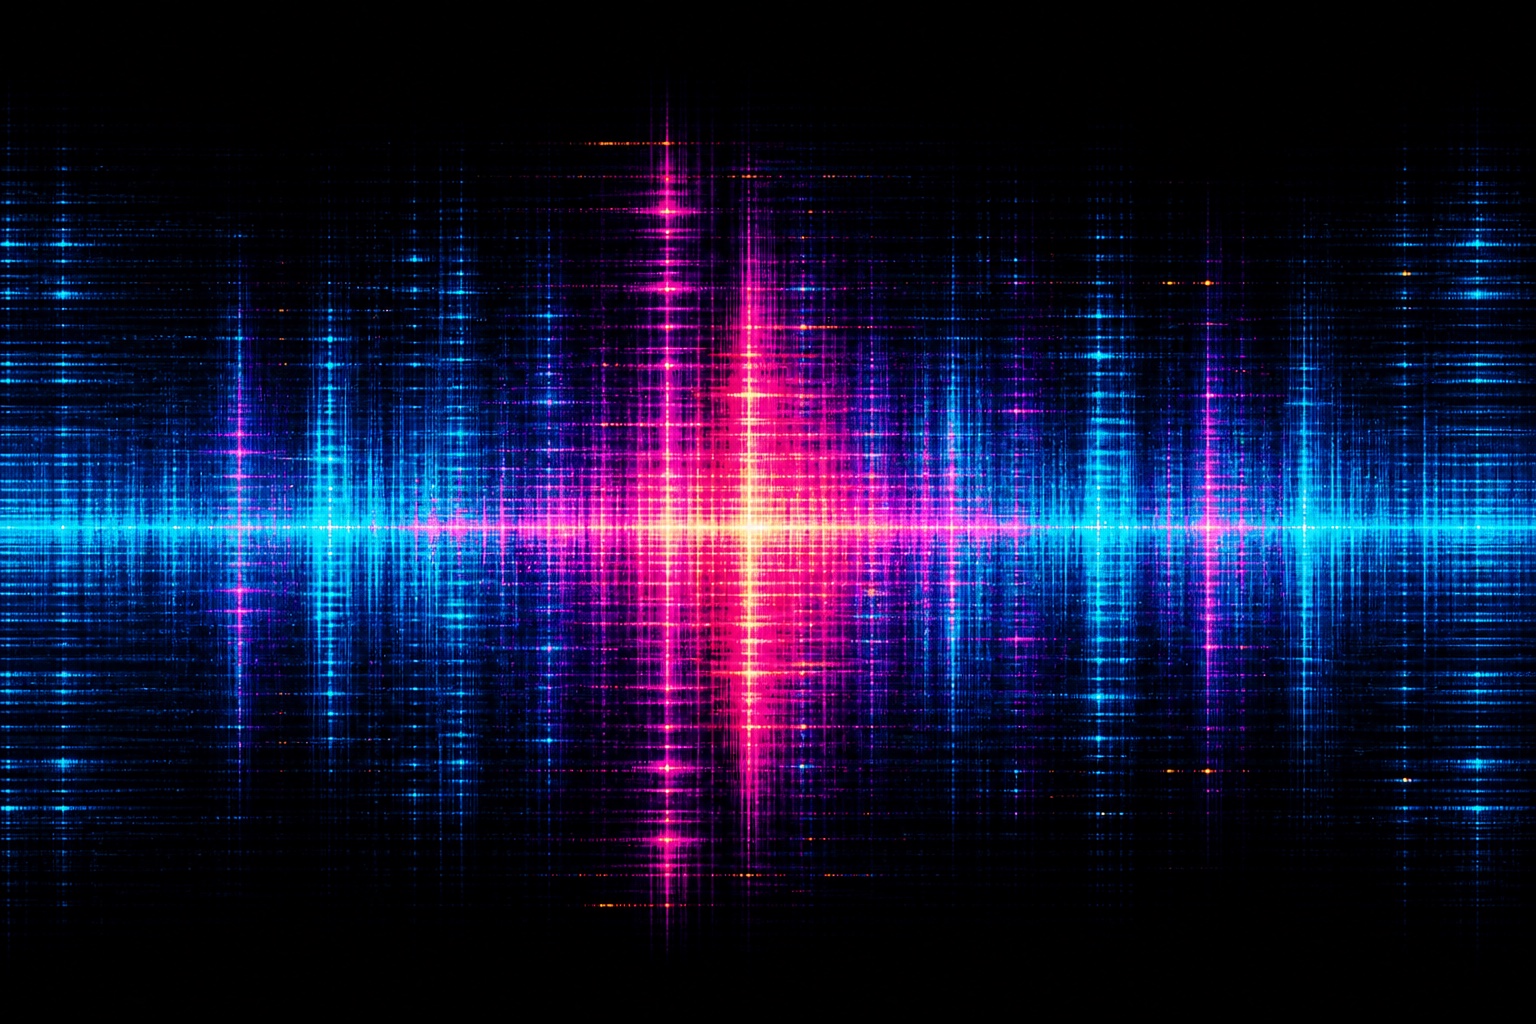

At a glance
Visual cues
- The time-frequency plane
- Intensity as shading
- Voiceprint patterns
- Hidden-image play
Best used for
- Locating noise or overtones in a recording by eye instead of ear
- Explaining how a sound changes as a single figure along time
Use this style
Take the compact brief into a project or hand the structured version to an AI tool.
Detailed guidance and sourcesProduction rules, reference works, comparisons, research and citation formats
Dictionary entry
- Type
- A log frequency axis, scale and units printed inside the figure
- Composition
- Time across and frequency up, an intensity key alongside
- Material
- A colormap rising monotonically in lightness, never rainbow
- Caution
- Drawing without choosing a window length skews the tradeoff between time and frequency resolution, and artifacts get read as real features.
- Further study
- Bell Labs voiceprint research / ornithology's sonograms / Aphex Twin's hidden faces
Related entries
- Cymatics (サイマティクス)Same Diagrammatic Expression lineage.Compare Spectrogram and Cymatics
- Photomicrography (顕微鏡写真)Shared effects: Technique / Calm.Compare Spectrogram and Photomicrography
More from Diagrammatic Expression
Continue through styles in the same Diagrammatic Expression family, prioritised by shared effects.
- Origami Diagram (折り図)Shared effects: Technique / Play / Calm.
- Isometric Illustration (アイソメトリック・イラストレーション)Shared effects: Technique / Play.
- Anatomical Illustration (解剖図の様式)Shared effects: Technique / Calm.
Browse all Diagrammatic Expression entries
Cite this entry
The dictionary is meant to be linked to. Take whichever form fits where you are writing.
- Link
- https://indexstyle.org/styles/spectrogram
- Markdown
- [Spectrogram — IndexStyle](https://indexstyle.org/styles/spectrogram)
- HTML
- <a href="https://indexstyle.org/styles/spectrogram">Spectrogram — IndexStyle</a>