Explorable Explanations vs Scrollytelling
エクスプローラブル・エクスプラネーション / スクロールテリング
Both are web articles with diagrams and charts set into the running text, and in both the reader's action changes the diagram.
How to tell them apart. If scroll position alone advances the diagram and scrolling back restores it, it is scrollytelling. If you grab a number in the text and move it, it is explorable.
Explorable Explanations


The name Bret Victor gave, in a March 2011 essay of the same title, to writing that embeds a running model inside the prose. Numbers in the body text carry a dotted underline and can be dragged, and pulling one rewrites the rest of the sentence and the figure beside it at the same time. He described the result as a written argument whose assertions are backed by explorable computational models.
Scrollytelling
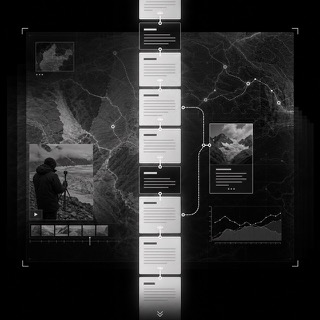
A web page form in which the reader's scroll position is the clock of the story, with graphics, maps and video changing as the page moves and reversing when the reader scrolls back. Visualization researchers treat it as the web equivalent of long form journalism and describe its structure as either linear or elastic, the elastic kind letting a reader dive deeper on demand. News outlets including the New York Times, the BBC and The Economist built the form out.
| Explorable Explanations | Scrollytelling | |
|---|---|---|
| Era | 2011– | 2012– |
| Family | Reading on the Web | Reading on the Web |
| Kind | Technique | Layout |
| Cues | Numbers inside the running text sit on a dotted underline and turn blue when touched / Dragging one of those numbers rewrites the following sentence and the neighboring figure at once / Figures are not quarantined in a separate sandbox but sit continuous with the paragraphs around them / Untouched, the piece still reads, because the default values already make the figures meaningful | A graphic that holds still on screen while a single narrow column of text passes over it / Changes made by opacity and by moving a map, so that scrolling back undoes them in the same order / Photography, video and data visualization sharing one article / A path that is either straight through or branches into an optional deeper detour and returns |
| Best used for | Publishing an explanation built on a model, where readers should be able to change the assumptions themselves · Teaching material that has to show not just the conclusion but the conditions under which it flips | Laying out an investigation or a research explainer as one page where the graphic holds and only the text moves · Giving a long read on a phone a way to advance that needs no instructions |
| Type | Set the prose like ordinary reading matter; mark only the live numbers, with an underline and a color, and never with a different typeface. | Keep the body in one column. The scroll sets the pace, not the page, so hold the measure narrow and place headings only at joints in the story. |
| Composition | Hold the text to a single column of roughly 600px and place each figure beside or directly after the paragraph it belongs to, close enough that the handle and its effect share one field of view. | Pin the graphic and let the text pass over it. How many paragraphs you assign to one graphic is the pacing. |
| Material | Limit the interaction to grabbing and dragging, with no input fields and no submit buttons, and always ship default values that already say something. | Build only changes that can run backwards, such as opacity crossfades and map moves, each tied one to one with scroll distance. |
| Caution | If the content only shows up once the reader touches something, everyone who does not touch it gets a blank article. | Tying a one shot animation to the scroll leaves a reader who scrolls back looking at nothing, and makes the middle of the article impossible to reread. |